


前言
因為有多個國家的網站,原本使用 Seq 作為 log server,但因為同時間只能有一個人登入,每個國家都需要各自的容器服務,為了簡化運維,打算將 log server 換成 Grafana,並在學習 K8s 時發現 Grafana、Loki 和 Prometheus 成為常見的標配。
首先,讓我們解一下什麼是 Grafana
Grafana 是一款開源的資料視覺化和監控平台,讓你可以輕鬆建立互動式儀表板,從多種數據來源即時監控系統狀態,主要是由以下三大服務組成。
- Grafana:這是一個視覺化平台,可以整合各種來源(像是 Loki 和 Prometheus)的數據,並製作圖表和儀表板,方便監控。
- Loki:專門用來收集和管理日誌數據,跟 Grafana 整合後,可以在同一平台上分析日誌和監控數據,快速找出問題。
- Prometheus:主要負責收集和儲存系統監控指標數據,提供系統健康狀況的監控依據。
開源日誌服務
聽了幾位網友分享,純Log服務的話,如果是地端可以考慮使用Graylog,也是一套不錯的Log 軟體,但Loki的優勢在於輕量化,上雲可以節省一些資源,Loki在和Grafana系列的產品整合比較容易。
接著,部署 Loki 日誌系統
docker run -d --name=loki -p 3100:3100 grafana/loki:latest
Loki 支援 RESTful API,因此我們可以透過 Curl 操作。
新增日誌
# const createdAt = Date.now() * 1_000_000; // js 將計算後的結果貼到這裡 createdAt
@createdAt = 1693022700000000


POST http://localhost:3100/loki/api/v1/push
Content-Type: application/json

{
    "streams": [
        {
            "stream": {
              "app":"nextjs-app" // 可以將你的動態資料放在這,可用來分類、篩選、繪製報表
            },
            "values": [
                ["{{createdAt}}", "write your logs in here"]
            ]
        }
    ]
}
查詢日誌
GET http://localhost:3100/loki/api/v1/query?query={app="nextjs-app"}&limit=10
接著,我們安裝 Grafana
運行 Grafana 容器服務
docker run -d --name=grafana -p 7777:3000 grafana/grafana
登入後台,預設帳號密碼:admin/admin
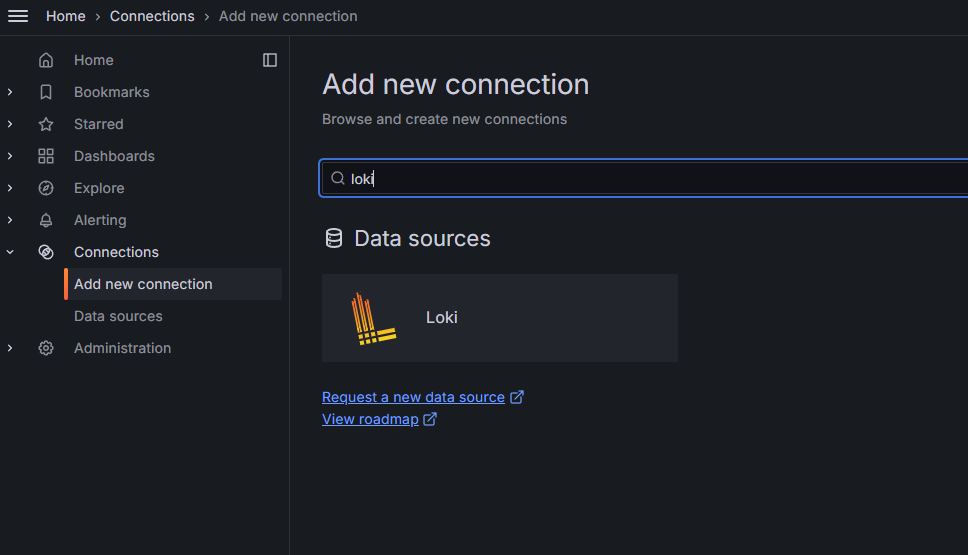
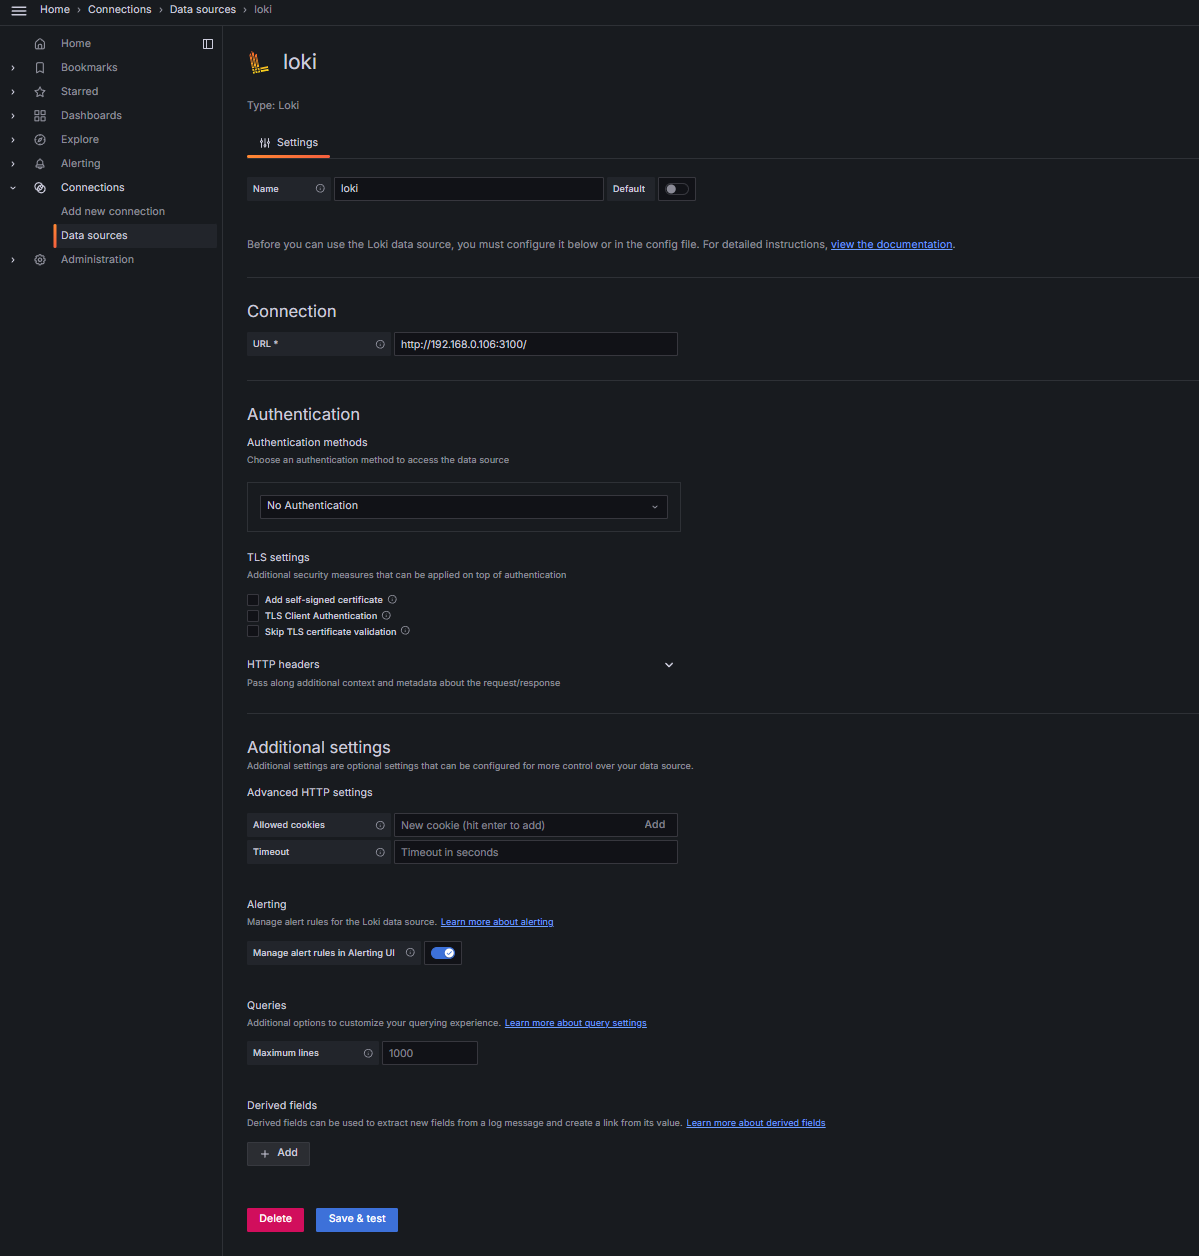
接著[訪問 Gafana 的後台] > Connection > Add new connection> 選擇先前建立 Loki 服務
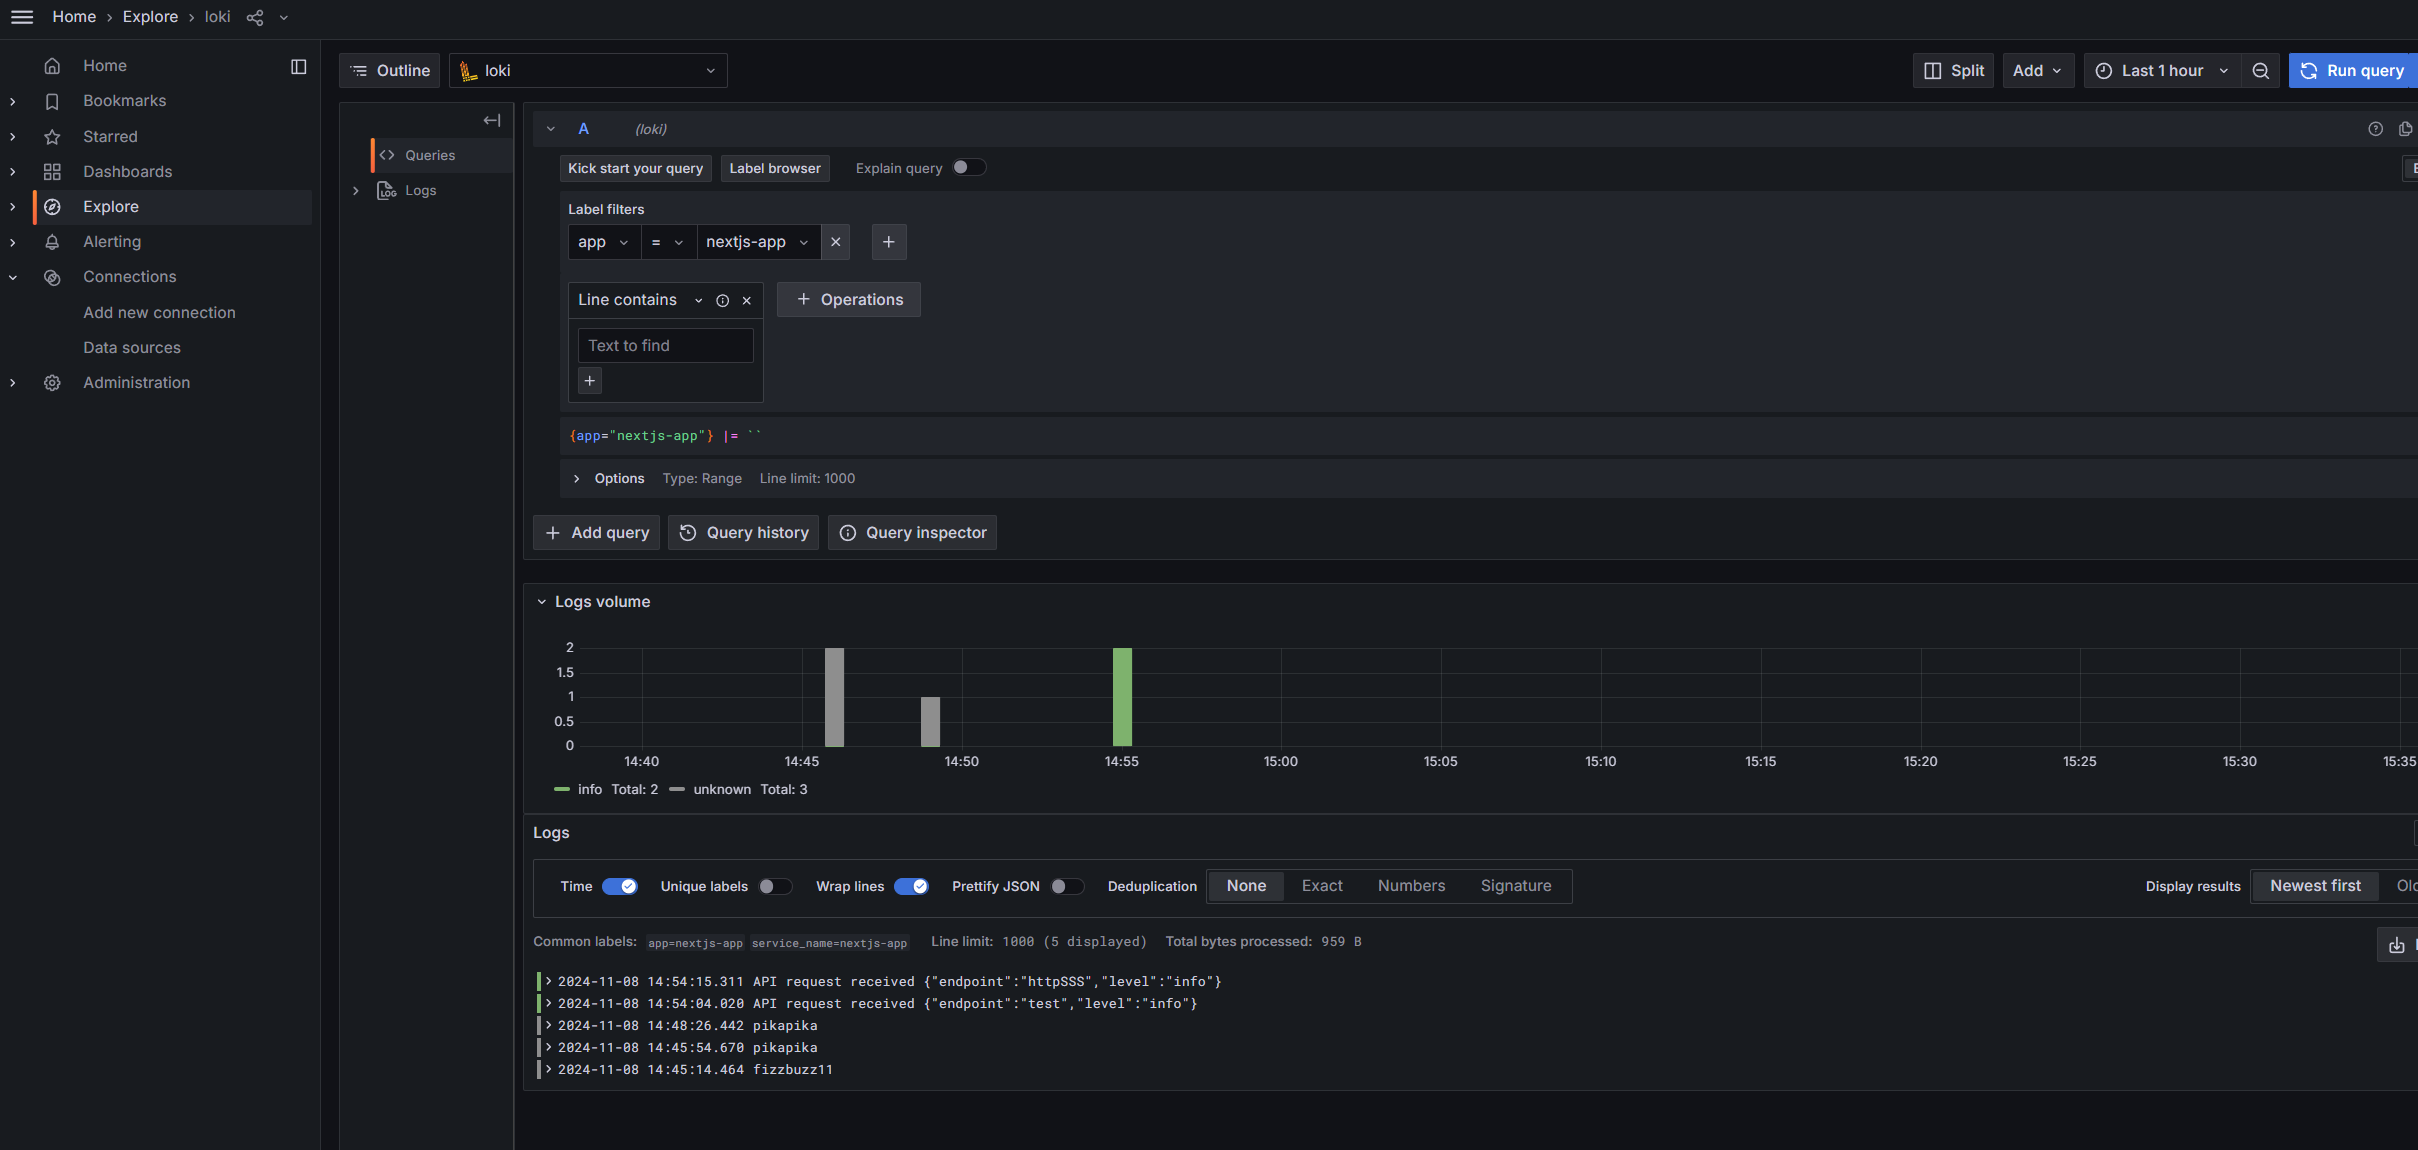
此時就能透過後台的Explore功能去查詢剛剛寫入的日誌,但至少要有一個篩選條件,不然會查不到。
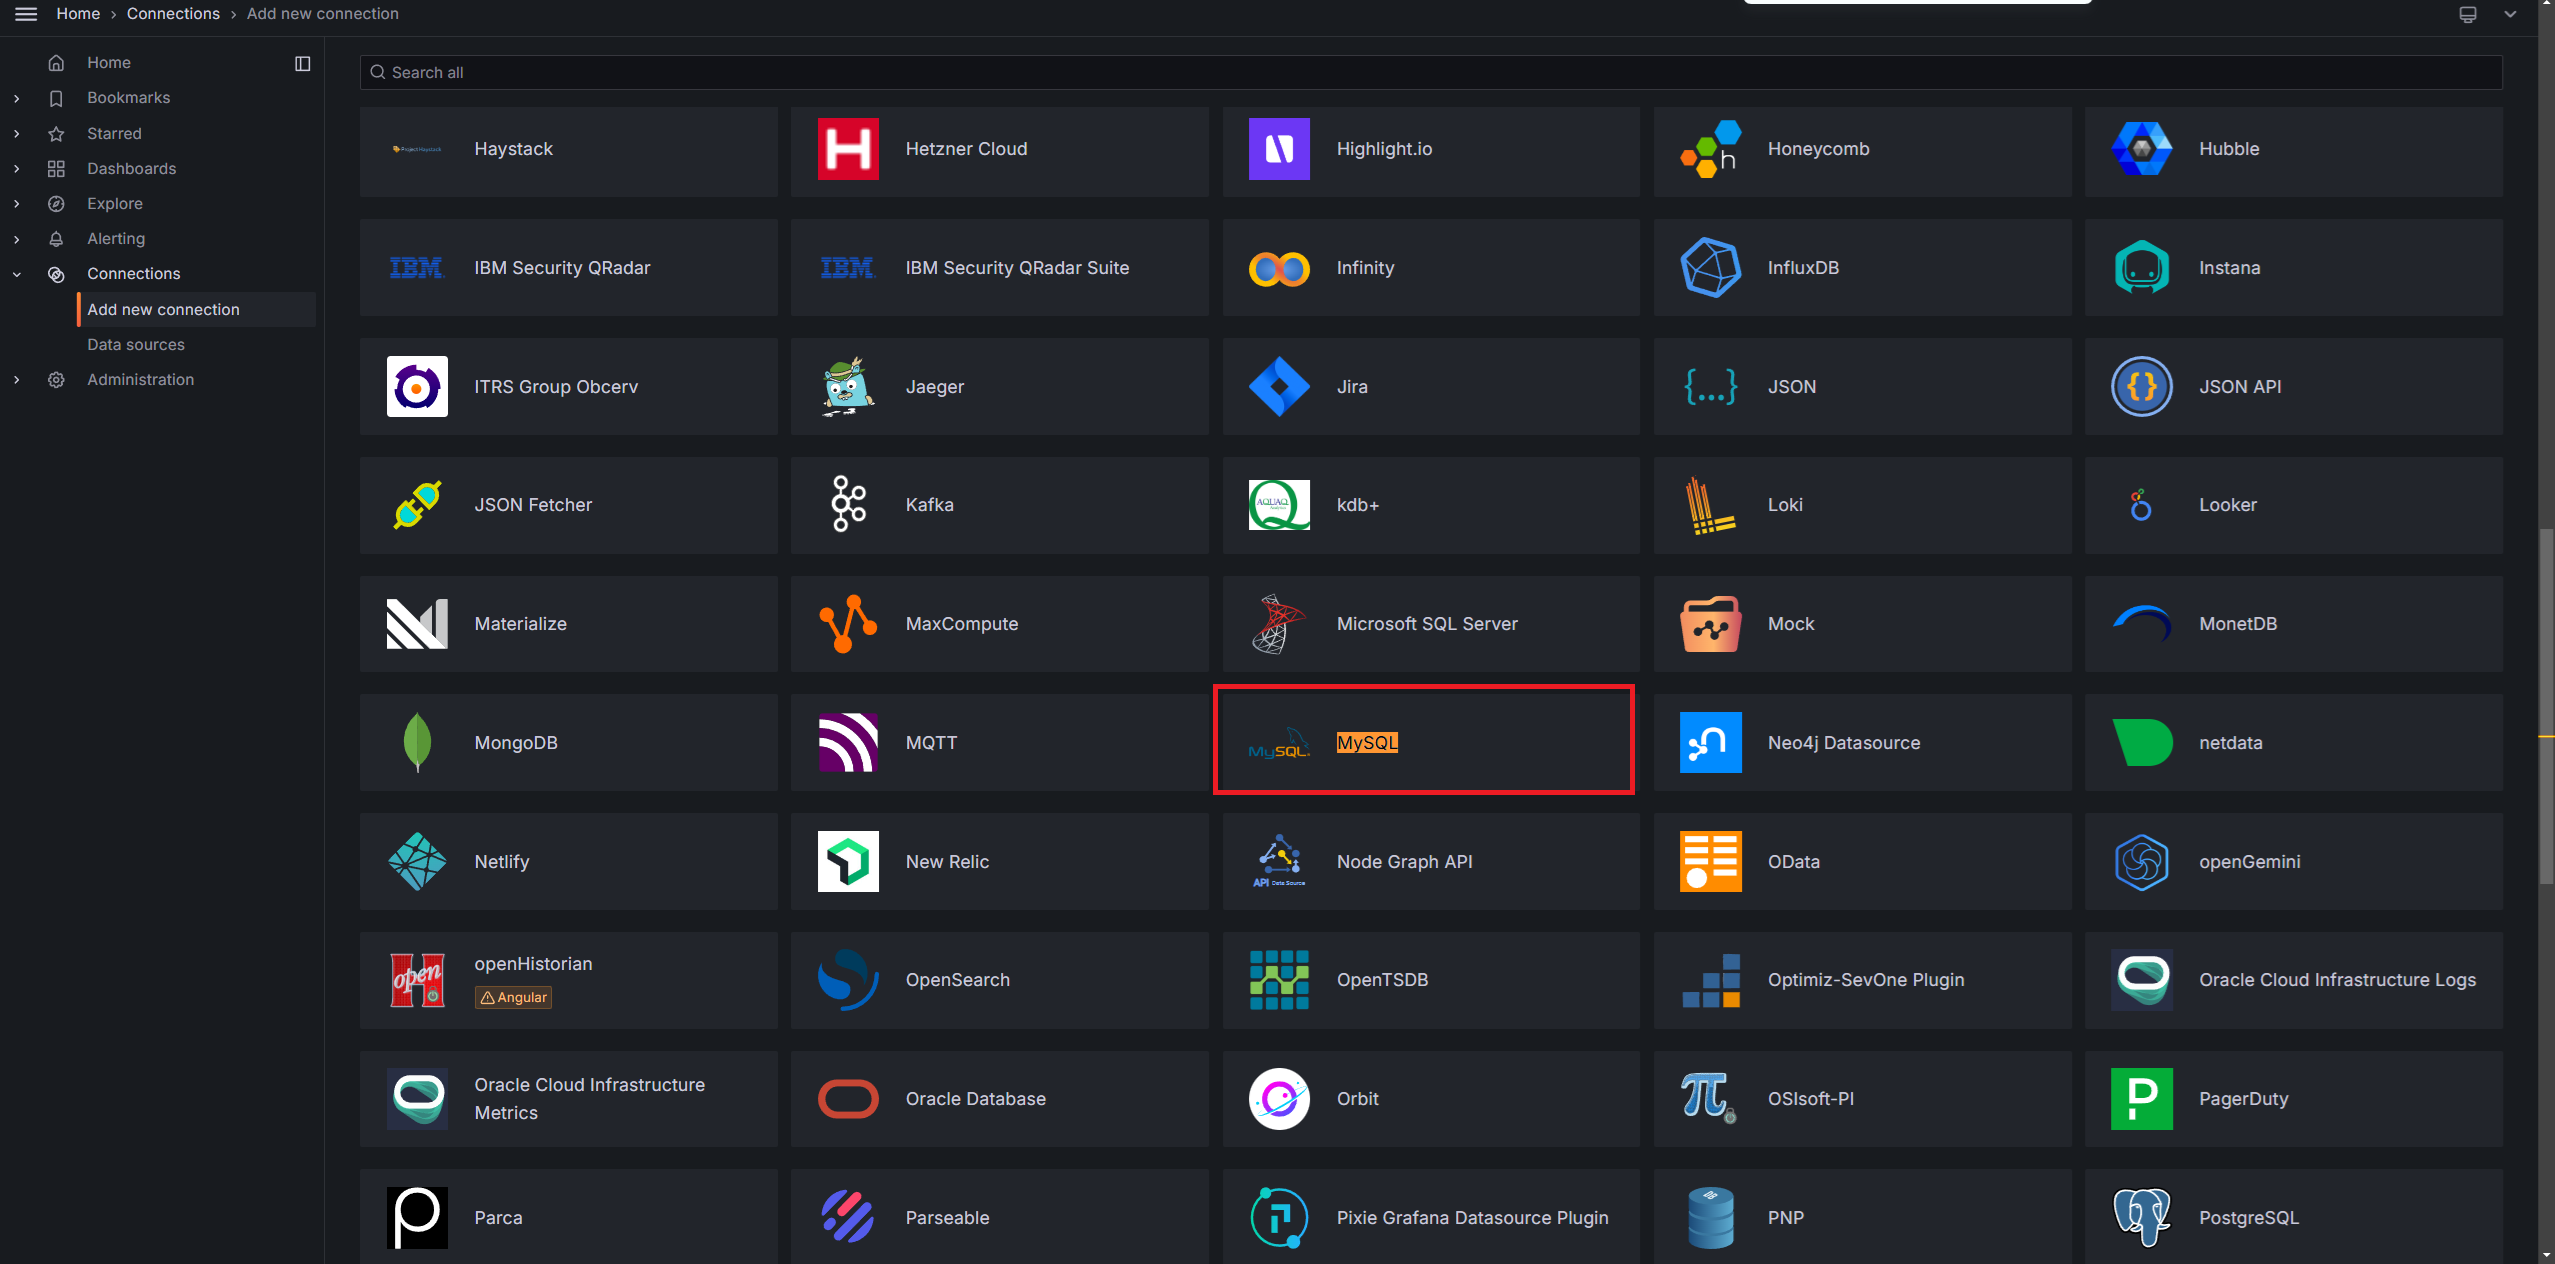
補充: 其實 Gafana 支援很多資料庫或服務當成資料來源,像是Mysql、Jira,可以很輕易去讀取這些資料做成圖表。
程式界接
在 Next.js 中整合 Loki
接下來,在 Next.js 後端安裝所需的套件:
npm install winston winston-loki --save
撰寫一個 logger.ts
import winston from 'winston';
import LokiTransport from 'winston-loki';

const logger = winston.createLogger({
  transports: [
    new LokiTransport({
      host: 'http://localhost:3100',
      labels: { app: 'nextjs-app' },
      json: true,
    }),
  ],
});

export default logger;
在頁面中使用時:
import logger from '@/lib/log/loki-log';
logger.info('API request received', { endpoint: 'https://www.abc.com' });
前端應用:透過 fetch 寫入日誌
const LogLevel = {
  Information: "info",
  Debug: "debug",
  Warning: "warn",
  Error: "error",
};

async function clientLog(message, level = LogLevel.Information, extraLabels = {}) {
  if (!message) return;

  const timestamp = `${Date.now()}000000`; // 將毫秒級時間轉為納秒級
  const logData = {
    streams: [
      {
        stream: {
          app: "frontend-app",
          level: level,
          ...extraLabels, // 額外的標籤,例如用於區分不同頁面或功能
        },
        values: [
          [timestamp, message]
        ]
      }
    ]
  };

  try {
    const response = await fetch(LOKI_URL, {
      method: "POST",
      headers: {
        "Content-Type": "application/json",
        // "Authorization": "Bearer YOUR_TOKEN" // 如果 Loki 設置了 Token 驗證,啟用此行
      },
      body: JSON.stringify(logData),
    });

    if (!response.ok) {
      console.error("Failed to send log to Loki:", response.statusText);
    }
  } catch (error) {
    console.error("Error sending log to Loki:", error);
  }
}
// 發送信息級別的日誌
clientLog("This is an informational message", LogLevel.Information, { page: "home" });

// 發送錯誤級別的日誌
clientLog("An error occurred", LogLevel.Error, { page: "checkout", userId: 12345 });
補充: Loki 如果要加上令牌,最簡單的方式是透過 nginx 轉發請求時,加上請求令牌驗證
server {
    listen 80;
    location /loki/ {
        proxy_pass http://localhost:3100; # Loki Url
        proxy_set_header Authorization "Bearer YOUR_TOKEN"; # 令牌
        # 可根据需求限制访问的 IP、路径等
        if ($http_authorization != "Bearer YOUR_TOKEN") {
            return 403; # 拒绝访问
        }
    }
}


留言